An Inside Look at FeedbackSwift

Deciding which software your company should use is no easy task. Numerous factors are hastening your decision and even more bewildering it.
A free trial solution seems to be working in theory only because there simply is no time to wander around aimlessly.
If your current priority is obtaining valuable feedback, some of the branded and well-known cloud solutions most likely targeted you with their sponsored ads, chasing you all around the internet.
We decided to go for a different approach. Believing in the underlying strength of screenshots and testimonials, we wanted to bring you the ease of using FeedbackSwift for various data acquisition, without imposing our sign up link or offering you free trials. Naturally, you can always do so in your own time.
Here’s a peek at our software along with a few simple explanations.
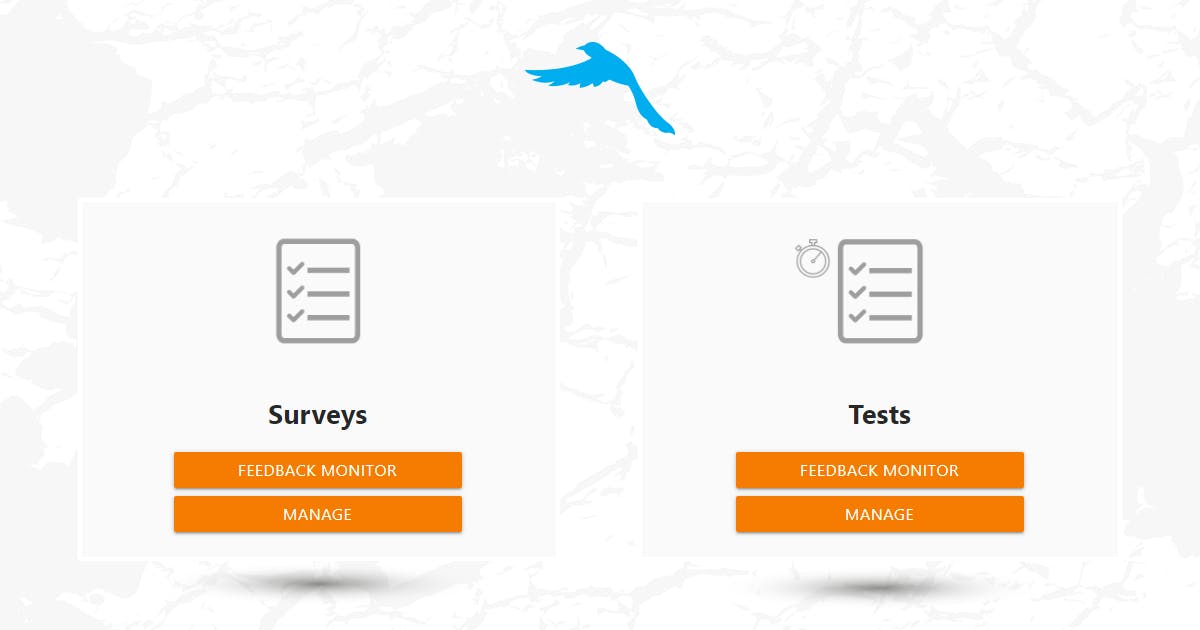
Cockpit
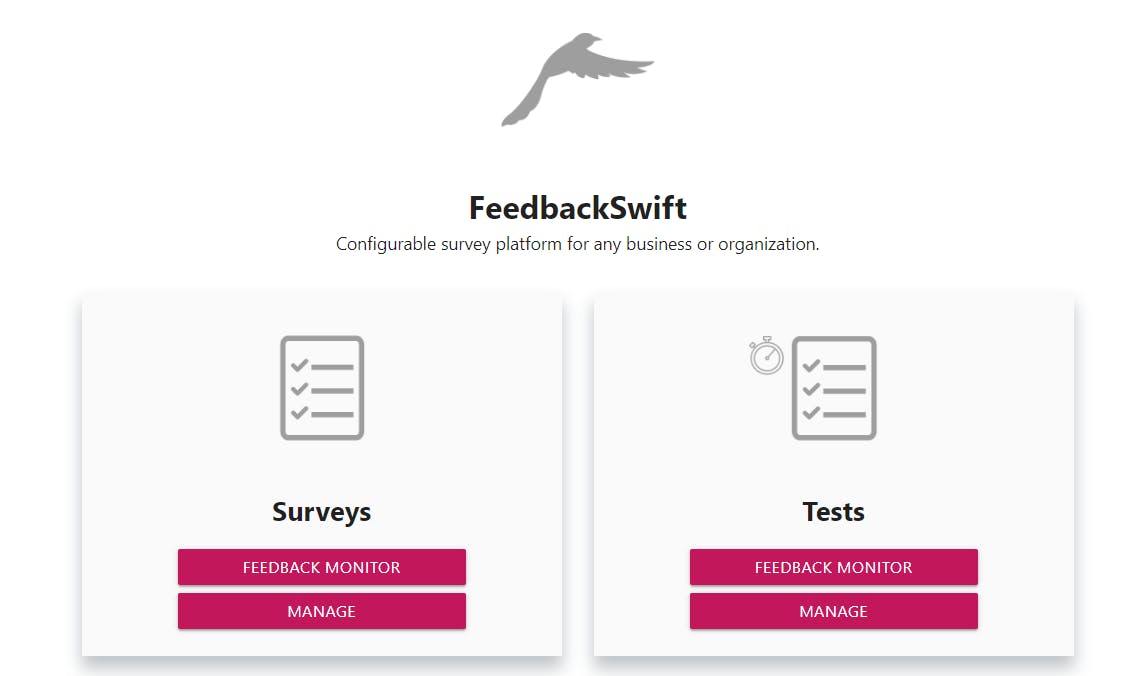
This is the starting point of your survey adventure. No confusing mess. A lot of white space. Just a simple choice between creating/managing your project and monitoring its results.
Dashboard
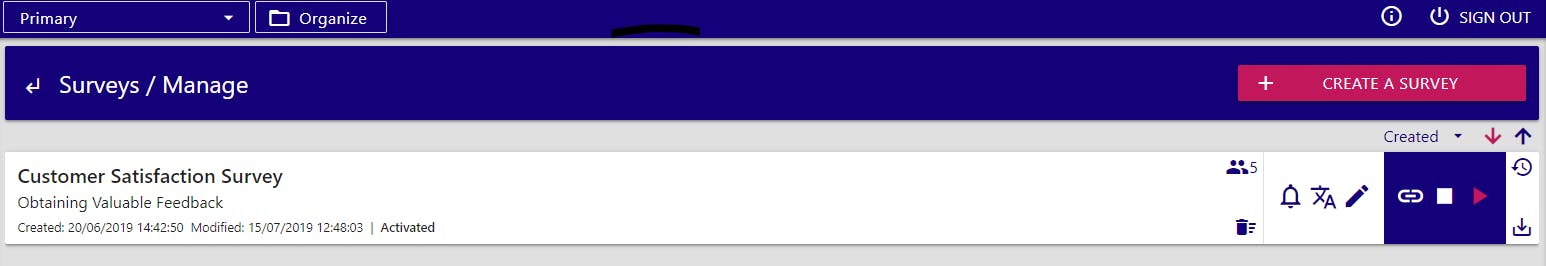
The dashboard navigation is pretty self-explanatory and intuitive. Brief explanations snippets are displayed once the cursor is on the item, so there is no real need to turn to help center.
Under “Create a survey”, you can choose to create a new survey from scratch, clone one, or upload it from a file.
For the sake of demonstration, we’ve selected to create a new survey.
Configurator
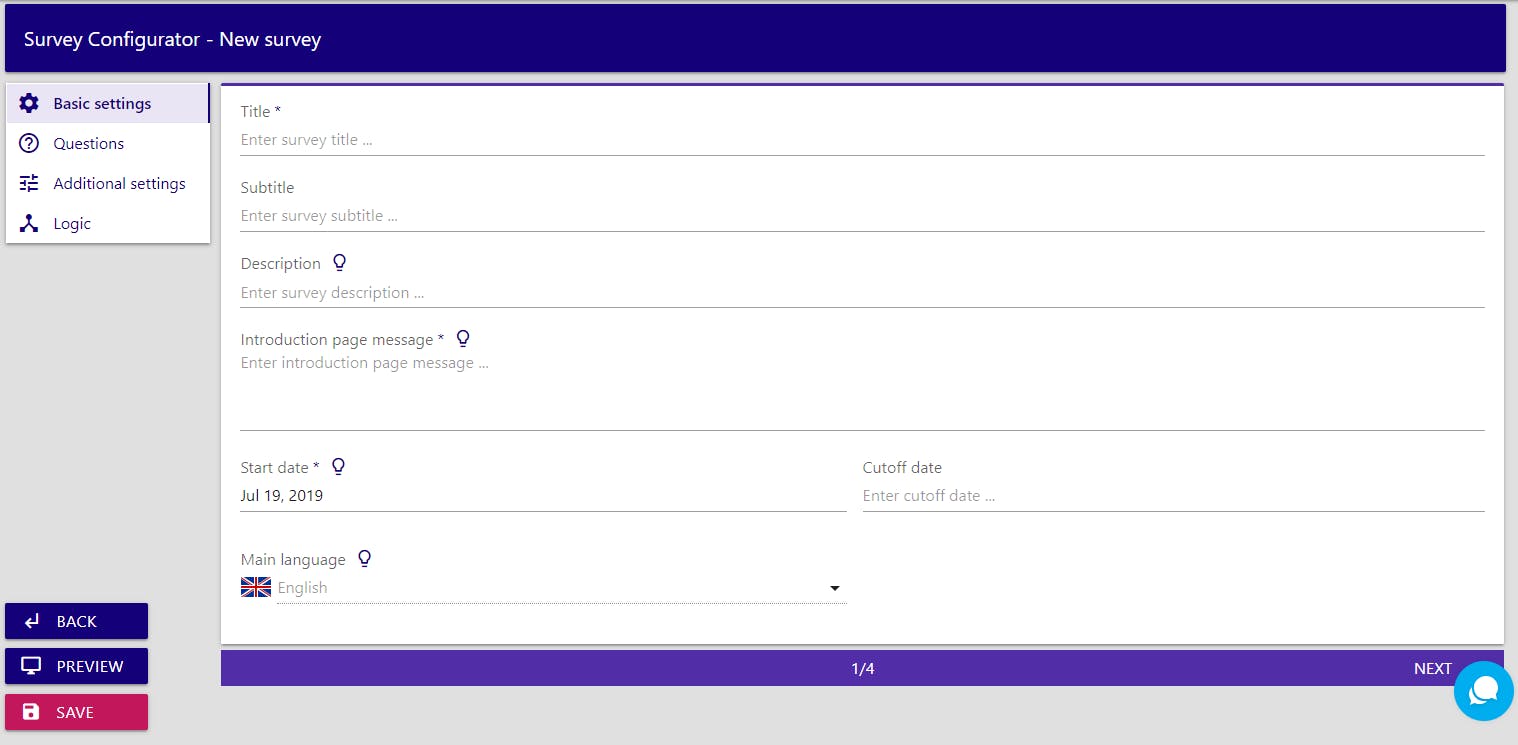
Once you’re in the configurator itself, the system will guide you through a group of settings required to make your survey complete. It’s important to note that you can’t hit “next” until you fill all the relevant fields, so there is no risk of activating a survey that is half-done and imperfect.
The essential information of your project includes its title and subtitle, a short description, an introduction message to your respondents, survey’s main language, and its duration. After you’ve completed this section, you can head to the question manager.
Questions
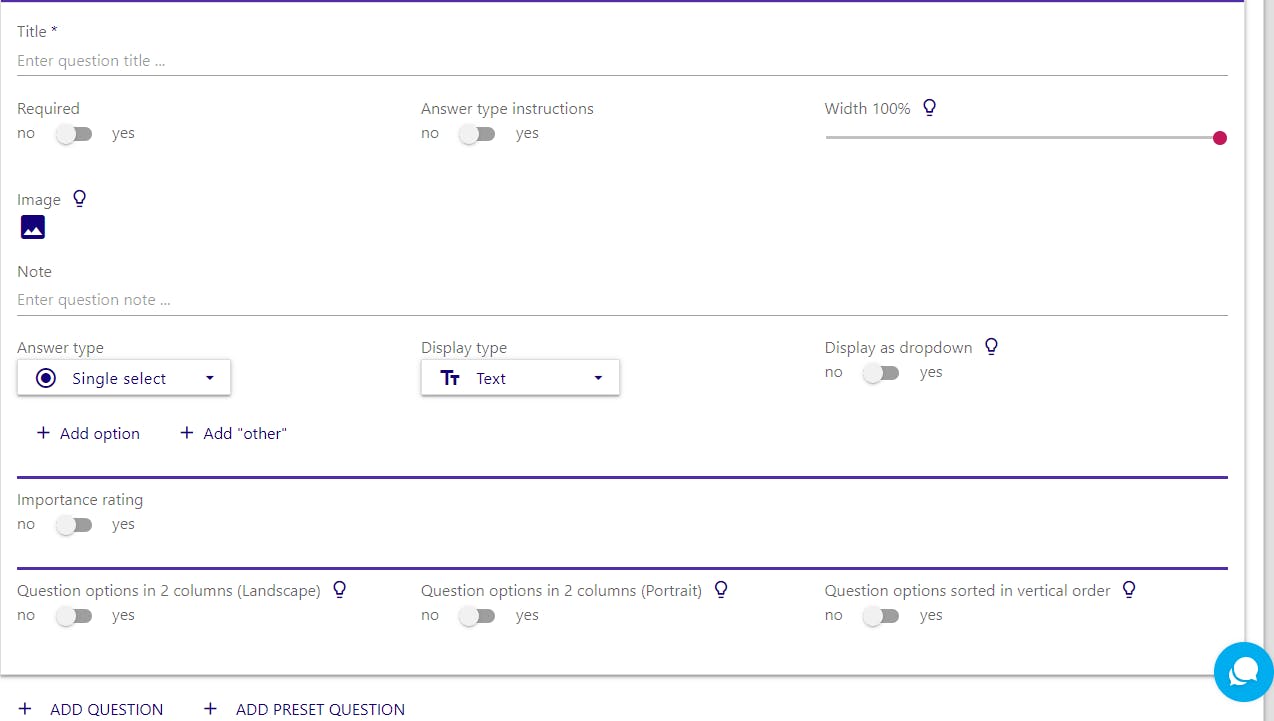
Believe it or not, there are countless ways of asking a single question.
However, the entire complexity of the task cuts down to filling out a single page. It may seem overwhelming at first, but once you configure three questions only, it will soon become a matter of a few clicks. Furthermore, an embedded function allows you to preview your questions at any point, and edit them accordingly.
After you’ve asked all the relevant questions, the configurator will guide you to “additional settings” and “logic”, where you can polish your survey with last touches that will make all the difference. These include branching, obtaining IP addresses, providing different levels of anonymity, configuring completion actions, and customizing the survey’s appearance.
The only thing you have to do now is to save and preview your project to make sure everything works perfectly.
Feedback monitor
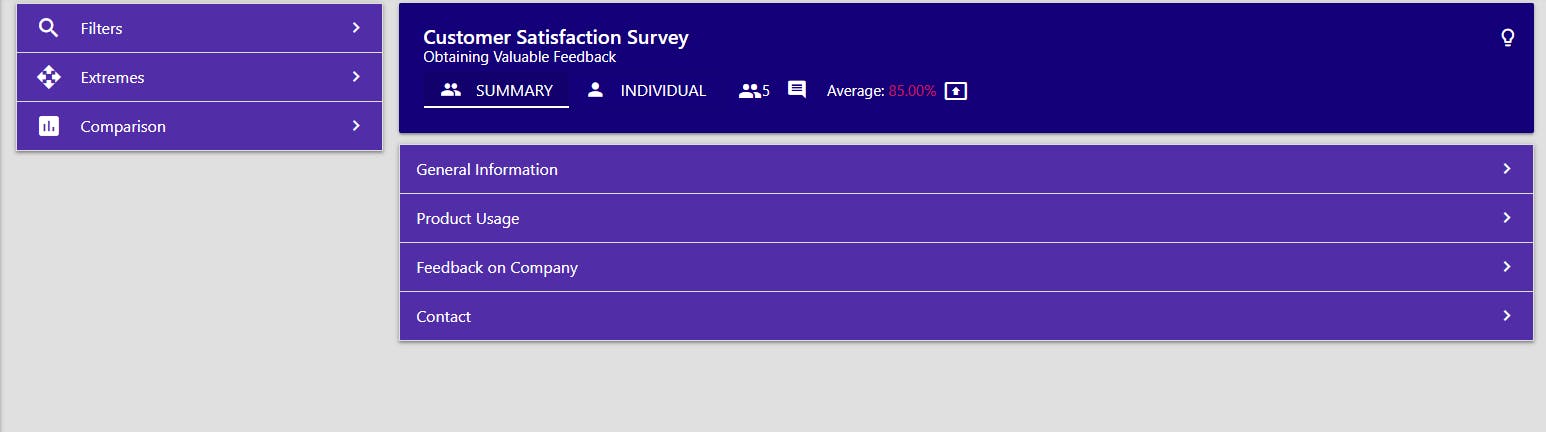
The analysis dashboard is actually a lot more complex than our screenshot here, offering a variety of tools and filters to interpret your results.
You can choose between individual or summary view, apply various filters, compare data, and understand its extreme values. Visualize those via different methods, including text, graphs, and pie charts.
Stay informed on your results and choose to receive a daily/weekly/monthly summary report on your e-mail.
Best of all, all the acquired data and its analysis are completely exportable and ready to serve various presentation purposes.
Did we make it easy for you, or not?